
When Is the Best Time to Take the SAT?
SAT scores on different tests can be compared, even if one test is “easy” and one is “hard.”
The College Board controls for the differences in the tests, making sure that each test is distributed across a bell curve.
They do this by changing the raw to scaled score conversion tables for each test.
How Scoring Works on the SAT and Why All Test Scores Can Be Compared
Parents often ask: during which month is it best to take the SAT? What are past year average scores and percentiles? How does scoring work on each test? There are a lot of misconceptions about “easy” and “hard” tests - maybe you’ve heard that the August test is easier than other months, or the May test is exceptionally hard every year.
Luckily, that’s one thing you DON’T need to worry about when studying for the SAT exam. ALL SAT tests (after the 2016 redesign) are comparable through conversion. You can compare scores across years, months, and even regions, even if one test is “easy” and one is “hard.” How can this be?


Why Tests Can Be Compared
There are two major reasons why all SAT test scores can be compared, even if one is “easy” and one is “hard.”
A student’s subjective feeling about a test
Students may experience the same test in different ways depending on their relative ability. For example, a student who struggles with geometry might find a test really difficult, while another student might say it was incredibly easy. Or a student who struggles with severe test anxiety may find a test harder than a student who wasn’t anxious during the test.
So the difficulty of a test doesn’t necessarily correlate with how students experienced the difficulty of the test while they were taking it.
The College Board norms the tests
Some tests actually are harder than other tests. This could be because the reading passages are more difficult, or there is a higher distribution of questions labeled difficulty 3 across the test.
However, the College Board controls for these differences.
How does the College Board control for the differences between the tests?
Bell curve
A bell curve, or a normal distribution, is a way of thinking about how test scores are distributed over the population of all students who take a test. The majority of the scores lie in the middle of the curve. A smaller percentage of scorers get scores that are significantly higher or lower than the median score.
The College Board norms each test so that the score that the largest number of people get (on each section) is 500 - the middle score. Each test is optimized so the results always look like a bell curve.

A bell curve, or normal distribution. You can see that 68% of the scores fall within one standard deviation of the median score. This is how the College Board norms the SAT tests.
Raw to scaled score conversion tables
To see how the College Board norms each test to look like a bell curve, you can look at the raw to scaled score conversion tables for two different tests.
But wait, what’s a raw score?
The raw score is the total number of points right on the test. For example, math section 3 has 20 questions, and math section 4 has 38 questions. So there are 58 possible points you can get on math. The math raw score is the number of points you got correct out of 58. If you get every math question right, your raw score is 58.
Each raw score correlates with a scaled score - the section score out of 800. If your math raw score is 58, that means you didn’t get any math questions wrong. So your scaled score on the math section will be an 800. You add the scaled score from the math section and the reading/writing sections combined to get your total SAT score.
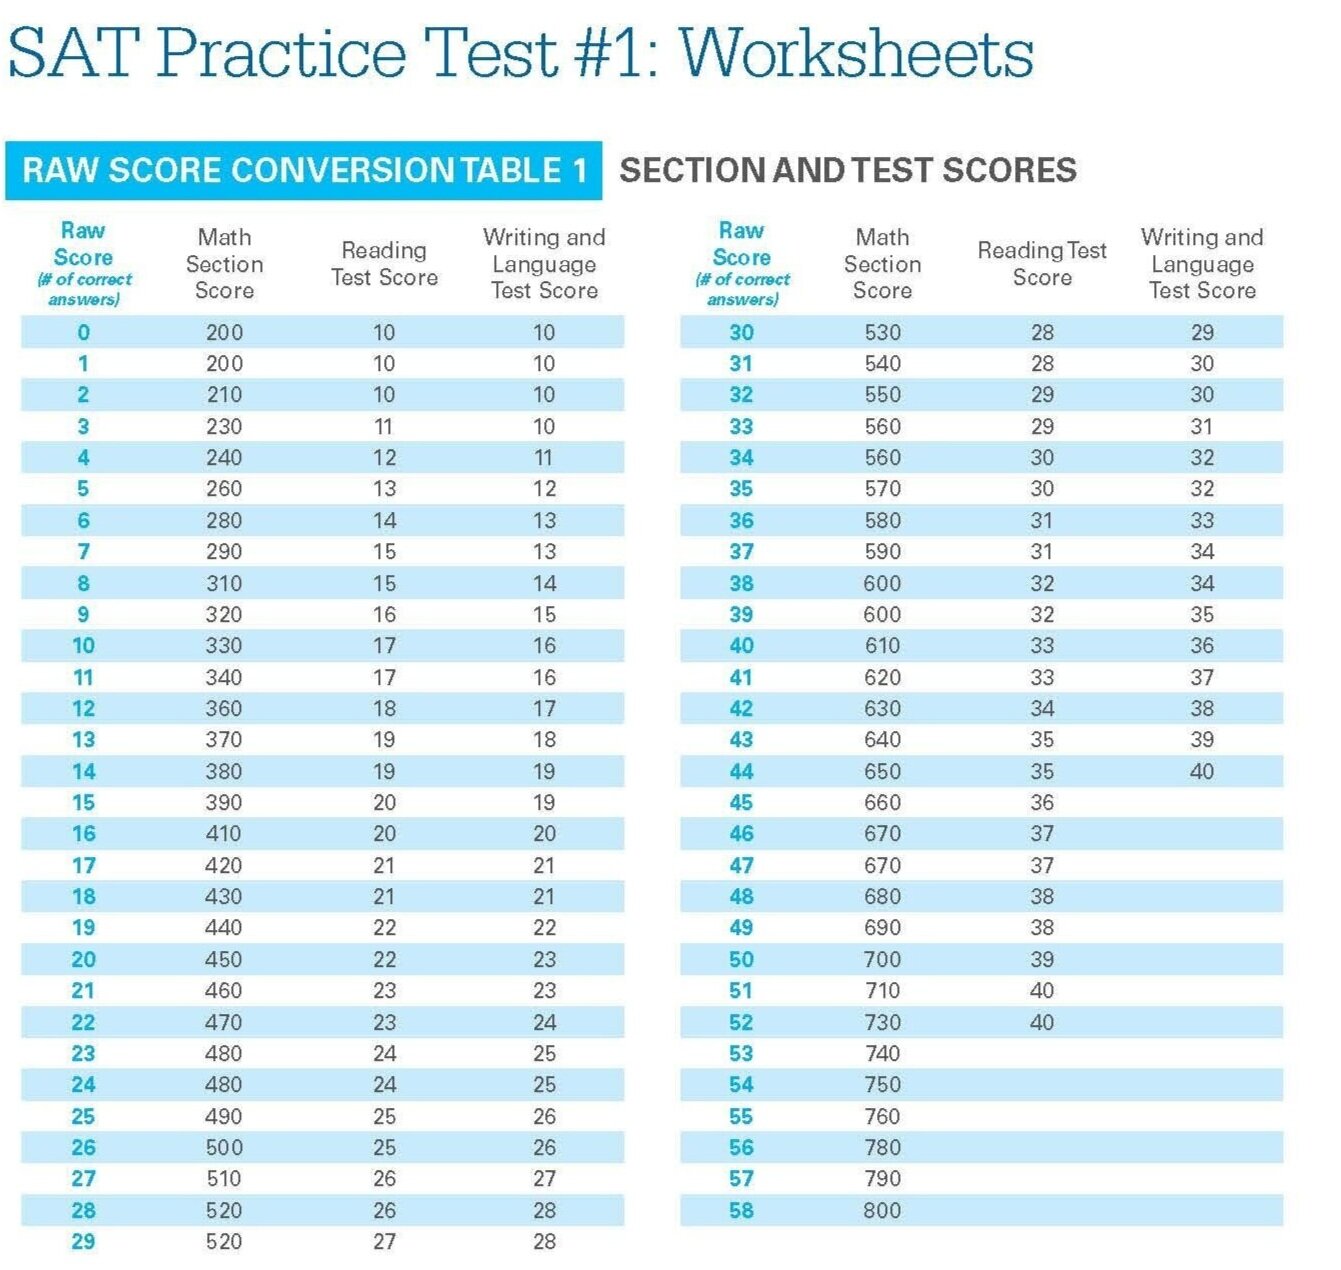
Let’s look at the raw to scaled score conversion tables for Practice Test #1 and Practice Test #8.
Look at the conversion table for Practice Test #1. You’ll see that the only way you can get a perfect math score is if you get all of the questions right - 58/58.
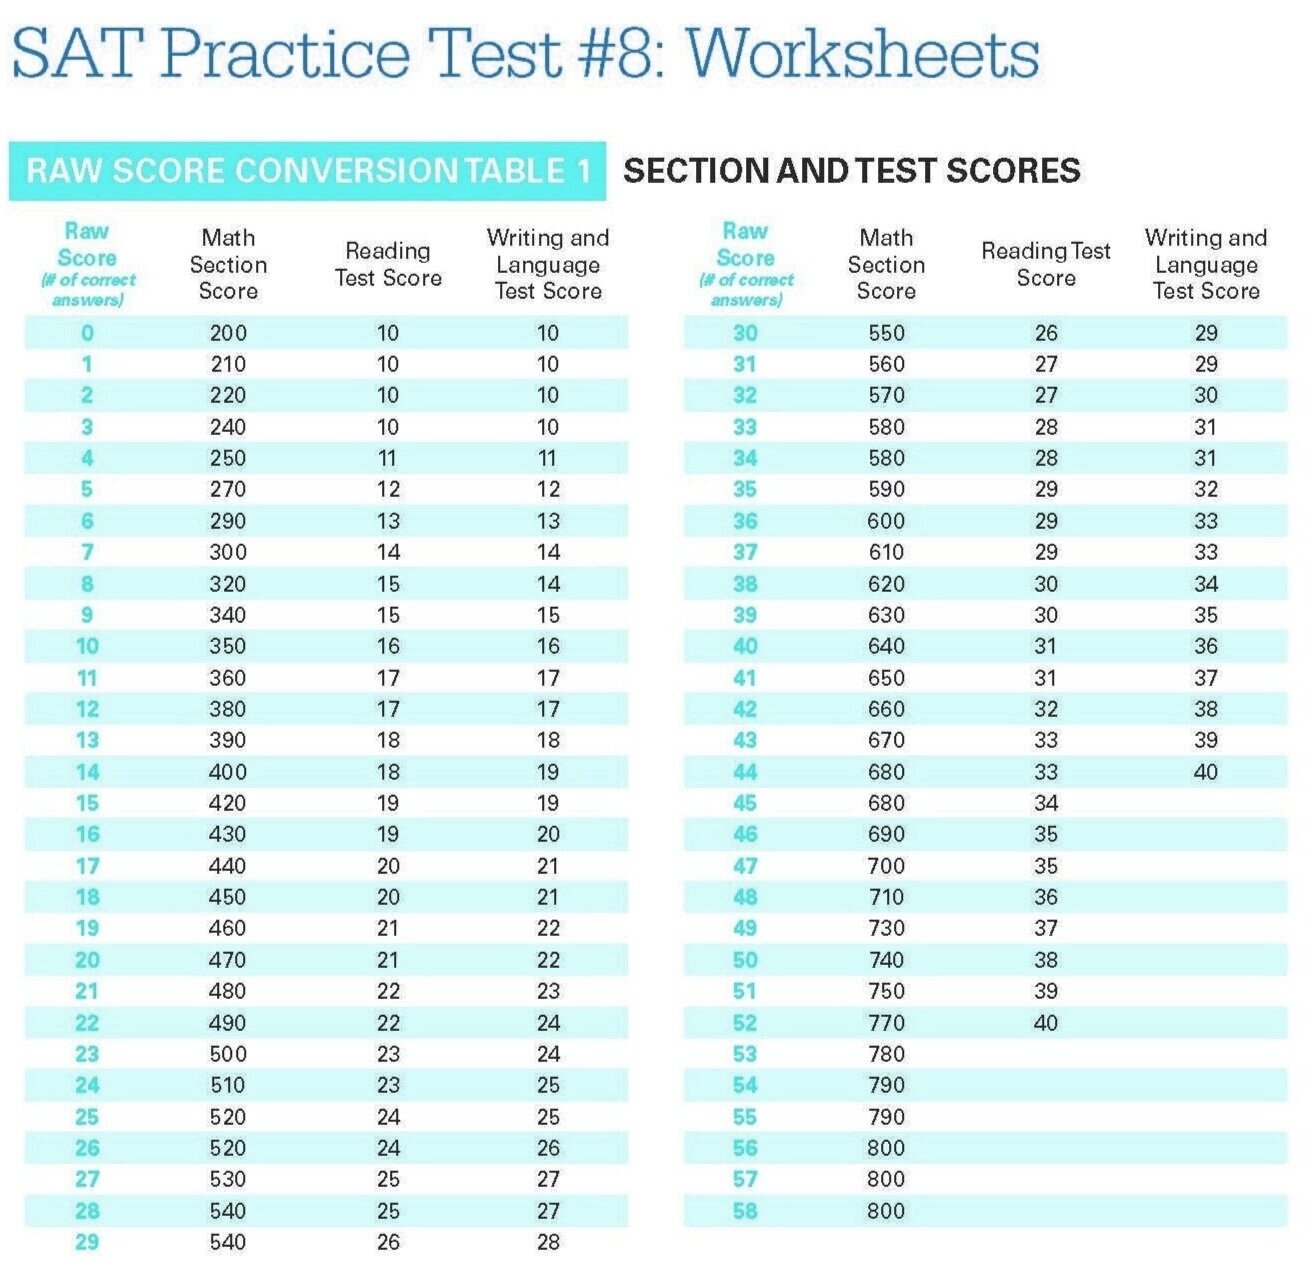
If you look at the conversion table for Practice Test #8, you can get up to 2 questions wrong on the math section and still get a perfect score.
This is because the College Board looked at Practice Test #8 and knew it was harder than Practice Test #1, so they change the score conversion.
The College Board has a number of ways of determining which questions are easy and which questions are hard.
The Question of the Day app releases an SAT question each day. It allows the College Board to gather data on who gets each question right and wrong. They use this data to determine which questions are hard for the majority of test-takers.
Every time the College Board gives a test, they know how many people get a certain question right and wrong. They aggregate that data into a central database. If everyone who did question 36 got it wrong, they know it’s a hard question and should be tagged as level 3 difficulty. But if most people who did #4 got it right, then it’s a level 1 difficulty.
According to all of these measures, the College Board can shape the scores into a bell curve. For this reason, it doesn’t matter which test you take. They all can be compared.